Disclaimer

Opinions and observations expressed on this blog reflect the authors' individual experiences and should not be construed to be financial advice. None of the members of this blog are licensed financial advisors. Please consult your own licensed financial advisor if you wish to act on any recommendations here.
Showing posts with label Bonds. Show all posts

Wednesday, May 7, 2014

Putting Riskier Assets Into Your Portfolio Stabilizes It?

Alright, that was a much longer hiatus than I would care to ever repeat and I decided to get back into the swing of things here by writing about one of my favorite little facts in portfolio theory. That is the peculiar fact that adding stocks to an all-bond portfolio actually stabilizes your returns and you get a higher return for less risk.

You know how economists always say there's no free lunch? Well, there's an exception to that rule and it comes from what is referred to as the "efficient frontier," which amounts to a rule about assessing the true relationship between risk and reward. Long story short, there isn't a straight linear relationship. There's a weird bend in the curve that makes a 27% stock portfolio as safe as a 0% stock, 100% bond portfolio and makes a 15% stock portfolio the least risky of all. For all of the charts below, I used data on total returns for stocks and 10-year U.S. from 1928 to 2013.


But wait, there's more! Because of the fact that adding stocks to a portfolio increases your long-term annual returns, this actually means that you can reduce your volatility and increase your returns in that backward-bending portion of the volatility curve. 


The idea that risk and reward are strictly linearly related has been a longstanding fallacy that most people buy into, but there are even every day exceptions to that. For example, you can walk into a street with cars going 25 mph and the odds are that they will stop and not run you over, even though they'll be incredibly angry with you for making them hit the brakes. However, they might not hit the brakes and then you'll be run over. The risk there is pretty high and the reward is saving a few seconds on your commute. 

The reason that it's not linear in the case of investments has to do with the fact that the factors which move stocks and bonds are different. Bonds typically do well in environments where investors are risk-averse and the outlook for inflation is declining, often because growth is declining. Stocks generally (surprise!) do well when growth prospects are strong. There are years where their interests coincide, very notably 1995 and 1982, because falling interest rates are good for bonds and stocks, all else being held constant. The consequence is a distribution of returns that looks something like this.


There's a smattering of about 8 years where they both do very well and you can see that in the upper-right corner, but otherwise there's a decently strong inverse relationship between the two.

So, the conclusion here is that by introducing a riskier asset class, in this case stocks, into a portfolio that starts as 100% bonds, you actually reduce your long-term volatility and increase your returns at the same time.

Now, a related question is what allocation avoids the worst performance historically. The answer isn't quite the same, but it's close. 


It works out that an 11% asset allocation to stocks has had the smallest 1-year decline of any asset allocation at just over a 7% drop. This of course prompted the question of what is the best year each asset allocation has seen. There's no question that 100% stocks will see the best year, but the rest of the curve is kind of interesting.


I know it's a little spooky, almost like Quantum Entanglement, but facts are facts and it's important to know what asset allocations are truly best for reducing volatility if that's your preference.

In case you're curious about the history of this idea, Harry Markowitz, one of the all-time greats in financial economics, was the one who really popularized it. 

With that, it's good to be back and I hope to be posting more in the future.

Thursday, March 10, 2011

More Nonsense About Public Pensions

http://www.nytimes.com/2011/03/11/business/11pension.html?src=busln


What follows does not represent the views of the State of Wisconsin, the Department of Administration, or the State Budget Office. 


Let me be blunt. Joshua Rauh, the Northwestern University professor behind nearly all of the scare-mongering on public pensions, is a malignant tumor and a fairly heavily metastasized one at that. His basic premise has been that public pensions are much more poorly funded than they look because they use unrealistic assumptions about rates of return. He claims that you should use a risk free rate of return, rather than a balanced portfolio's rate of return (historically nearly 8%), to discount future pension liabilities. For the uninitiated, discounting future liabilities at a lower interest rate makes your future liabilities a good deal larger. 


His real claim to fame was an article he published, along with a University of Chicago professor, at the pits of the stock market's decline in the most recent bear market where assets of the pensions funds were measured at fair market value (artificially depressed by nearly 50%) and compared it to liabilities discounted using 10-year treasury rates at the time (roughly 3.5%). I'm not actually sure that I need to explain what is wrong with this, but I will anyway because it actually offended me. In essence, what he did was take an artificially depressed portfolio and then assume an artificially low return from an artificially low level and say "My God! These things are horribly underfunded!". I would actually be curious what the fair market value measures would look like right now.


In any case, we all know that the assets of these funds have recovered sharply. That is evident in the Federal Reserve's Flow of Funds Report. Since Q1 2009, the assets of state and local government pension funds have recovered nearly $800 billion, or over 35%. What is more troubling is his bizarre assertion that pension liabilities should be discounted at a risk free rate of return. My simple response is: Why? That actually makes no sense. Why should long term assets be discounted at a rate that would only make sense if we expected to need them at short notice? His choice quote is “If you don’t want to count on the stock market to pay for all this, this is what you’re going to have to contribute.”. All I have to say is "Huh?!".


I wonder what the "unfunded liabilities" of 401(k)s look like if you compare current balances to future liabilities (i.e. your retirement expenses) if you discount them back at 10-year treasury rates. They are absolutely dependent on stock market returns after all. All of these plans rely on the stock market. Nothing else provides the returns reliably enough (yeah, I know what the response to this is). No person earning up through an upper middle class income could possibly afford to save enough through fixed income securities, even if they lived like a monk. If Rauh was honest, that's what he would say, but he doesn't. 

Sunday, March 6, 2011

Asset Allocation Model Update - March 2011

Since we have seen a particularly large run up following the last update of the asset allocation model, I thought it would be wise to assess what it is currently saying while the market seems to have stalled for a bit under the weight of both its own advance and a spike in oil prices due to the Middle East coming apart at the seems. 

While the allocation signal has shifted slightly away from stocks, it has not yet crossed the threshold to indicate that you should start moving into bonds. Part of the reason it has not yet shifted from the 80/20 split that we have seen for more than a year is that bonds yields became so depressed that they still have not normalized even after a serious drubbing since August. Bear in mind, this model is not necessarily a predictor of stock market returns in the aggregate, but rather where you should be positioned in stocks vs bonds. As of right now, it is still giving very favorable readings for stocks, though not nearly as favorable as in the summer of last year.

Incidentally, in July and August of last year, the model registered some of the strongest positive readings for a heavy stock allocation that the model has ever produced. Indeed, the reading given was just as strong as in March of 2009, indicating that stocks were poised to dramatically outperform bonds. 

It is gratifying to know that the big call has panned out correctly, especially since things looked a little hairy at the lows there. Barring dramatic global upheaval, which isn't a great bet these days, I would expect stocks to continue to modestly outperform bonds from now through the end of the year. 

Monday, November 15, 2010

The Municipal Bond Rout

One thing I've always marveled at is just how quickly a bond market panic can materialize. Case in point, the municipal bond market rout over the past several trading days.

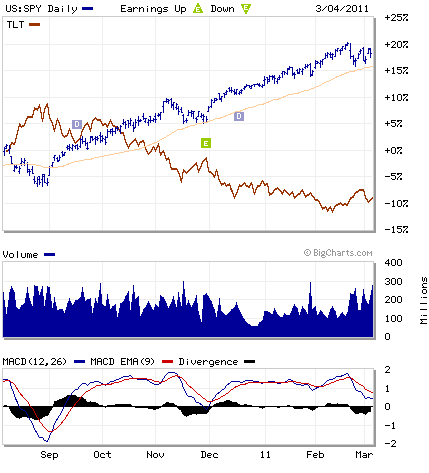
My favorite proxy for munis, MUB, has sold off in spectacular fashion, but this rout has not been entirely confined to munis. Treasuries have sold off too, as shown in this comparison with TLT.

Still, when you consider the generally narrower bounds in which MUB trades due to not only being long term securities, it is clear that this sell-off is more than just a turn away from government bonds generally. Now, as to the proximate cause of this panic, it is hard to say. There isn't a general financial panic like there was when muni bonds did this back in 2008.
That sell-off was caused by hedge funds desperately raising cash from whatever they could and they liquidated municipal bonds without mercy. This sell-off has been partially blamed on a large issue by California  coming to the market. I'm not so sure about that. I have a hard time buying that a $12 billion issue by California is enough to cause this mayhem. It is true that with Republicans now controlling one house of Congress that federal aid to state and local governments is unlikely to aid them as they attempt to bridge their budget gaps. Still, the election outcome was not a surprise and usually bond markets price things like that in.

The PIMCO California Municipal Income Fund (PCQ) might be making a bit of a fool of me, though. It has shown a sharper rout than munis in general and because California is such a large segment of the muni market this may make sense. However, with California now having the ability to pass budgets more easily, I'm not sure that questions about California's solvency are quite as pertinent as they used to be. Regardless, California munis have been obliterated.

Very oddly, this has been accompanied by a sell-off, not a rally, in gold. If there's one asset I would expect would do well in a rout of safe assets, it would be gold.

This bears watching and there's easy money to be made in munis if the sell-off gets out of control. Don't be so foolish as to pick up individual issues since if you happen to buy a special district's issues without understanding what revenue stream backs its payments, you can end up in a world of hurt. Those can and do default.

Friday, November 12, 2010

Strength of Treasury Auctions

This table is from Haver Analytics. When you look at the bid to cover ratios (value of bids/value of accepted bids), yes the recent auction was disappointing relative to auctions this year. However, when compared to actions in normal times, such as 2006, it's still stronger than at that point. I don't remember anyone in 2006 saying that the U.S. government was on the brink of default. 

The same certainly goes for shorter term bills and notes, where we have actually seen record high bid to cover ratios for some issues. Some of these levels are about 2x what they were in 2006. Generally, the shorter term you go right now, the higher the bid to cover ratios are. Bid to cover ratios have generally been a little bit stronger (and I do mean a little bit) on the short end of the curve than on the long end, probably due to there being a greater preference for more liquid assets. 

Now, what we are seeing in recent action is that bid to cover ratios for short term instruments are running around 4-5x compared to long term running around 2.3x to 2.7x. The reason for this disparity is that long term treasuries are simply a very risky proposition at these interest rates. The odds of significant principal loss are high whereas you don't run that risk with the short term bills. You don't earn any interest on them either, but it's still reflective of individuals and institutions being more concerned about capital preservation than appreciation. 
There was a bit of concern on Wednesday about a "disastrous" 30-year treasury bond auction. In truth, by the metrics that are typically used, it really wasn't that bad.

Sunday, November 7, 2010

QE and the Macro Climate for Stocks, Bonds, and Commodities

Since the Fed has decided to further monetize the debt in bid to try even more monetary stimulus, a few things are clear. One is that the Federal Reserve is absolutely nowhere near tightening and won't be for many months to come. That should be no surprise considering the size of the present shortfall in employment. The other is that the dollar looks like an extremely unfavorable investment right now, meaning that foreign stocks are comparatively more attractive in the interim as the supply of dollars will increase greatly as well as the fact that US interest rates will do a poor job of attracting fixed income investments. Foreign investors holding dollar denominated investments better watch out.

One thing that is abundantly clear is that financial markets have interpreted this Fed action as an all clear signal and everything from gold to Goldman Sachs (GS) has joined in. We are not in bubble territory in the stock market, though we are almost there in some, though not all, commodities markets. Those who are using commodities as a substitute for investing in financial assets in times of loose monetary policy continue to push those assets further and further from their fundamental values. There is no need to be worried about a bubble being fueled in the real estate markets. Those are so far deflated that no amount of monetary or fiscal stimulus could re-inflate them because investor expectations of returns have been so brutally throttled.

In the short run, meaning the next few weeks, I would not be stunned to see some retracement of recent gains on the order of as much as 5% in domestic stock markets. However, the next 12 months or so should be quite good. Earnings growth for the time being is strong and interest rates will not be a headwind. Commodities markets are probably a better than even shot to outperform in this environment as this global distrust of "paper" currencies seems to really be hitting a frenzy. However, once this current period of extremely loose policy relents those investments will crack much worse than the equity markets in the aggregate because there is much less of a link to fundamental value.

Stocks are supported by extraordinary levels of corporate profitability that make overall valuations quite reasonable. This is due in no small part to the current levels of slack in the labor markets that allow corporations to enjoy a larger share of productivity gains without passing them along as wage increases. However, lack of investment in both human and physical capital means, to a large extent, that corporations are cannibalizing future earnings for current earnings. Invariably this means that future earnings growth will be relatively muted as corporations need to hire and expand plant and equipment to grow sales as conditions normalize. That will prove to have a dampening effect on the later stages of the present rally.

Bonds, on the other hand, are currently being supported by Fed purchases, but this obviously will wear off, particularly as investors in long term bonds become frustrated by their low rates of return compared to high rates of return elsewhere. As such, prices will fall and yields will rise, possibly considerably. Long term treasuries are thus not a particularly good place to be.

Now, all of this is just my own opinion, which in no way constitutes professional advice, and I could certainly be wrong as I have been in the past. Still, it seems to me that this represents a fair summary of where we are right now.

Tuesday, September 14, 2010

Another Take on the "Bond Bubble"

Here's a somewhat more well supported take on the bond market from Angry Bear than what you'll see most places. His model suggests that bonds are properly valued at the moment and were actually somewhat cheap not that long ago. I haven't looked much into his model yet to see if there's something I disagree with in there, but given levels of GDP growth and inflation, it could well be that present bond prices aren't that overvalued.

I don't happen to buy into the thesis that bonds are a bubble in the same way that stocks were in 1999 or housing was in 2006. I think they are only modestly overvalued on an absolute basis, but they are very unattractive to stocks at the present time. Let me put it bluntly. Do you think that the total return of bonds, which will be the present yields at best considering prices are likely to drop as interest rates rise, will exceed that of stocks over the next five or ten years? Even after adjusting for the relevant risk premiums, stocks are quite a bit more attractive than bonds at the moment.

Tuesday, September 7, 2010

Shell Shocked Into Stupidity

Steve was kind enough to forward me this Newsweek article while I was at work today and now I feel the need to share it. http://www.newsweek.com/2010/09/07/young-adults-invest-conservatively-post-recession.html

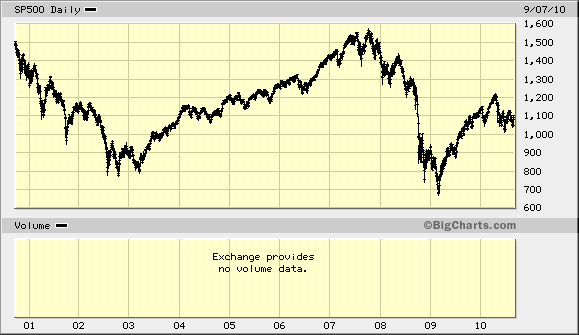
I have actually witnessed this among some in my age cohort (I just turned 24). I think I can speak fairly well on behalf of my generation when I say that we have not known a good investing climate. I mean, look at it:

That's the S&P500 over ten years and now financial advisors expect my generation, a very cynical and disillusioned lot to start with, to believe that things always do well "over the long term". I know people, and I won't name names, that honestly believe that the best thing you can do with your money is pile it ever higher into government bonds. They have been shell shocked by the grind of the financial version of The Somme into fairly morbid stupidity. Well, I suppose they are chasing performance since treasuries have absolutely butchered stocks over the last decade. However, I also remember after the last major bear market when a couple of my friends in high school told me that the only asset to invest in was "land", trying to evoke an air of nobility about their investments. How did that turn out?

I've been investing, with varying degrees of success, for this period and only this period. I've known nothing else but this horrible market, but it hasn't phased me because, if you are careful, there are winners among the carnage. Also, and this is much more important, it is important to realize that this last decade was somewhat anomalous for two major reasons: 1. The late 1990s bubble and 2. The housing bubble and the subsequent meltdown. Stocks came into the decade about, oh, 40% overvalued. The 1990s would have been a perfectly fine decade in absence of the last major run up, but it got out of hand for a number of reasons I am in the process of writing about for another post. Then of course we had the most serious financial crisis, well, ever since the Great Depression was actually more of a real economic contraction that caused a self-reinforcing financial crisis than the other way around, which is closer to what happened this time.

Admittedly, these sorts of events are not that uncommon in the context of financial market history. Indeed, bad decades (or similar intervals) seem to occur nearly one in every three for the period in which we have modern data. Is there any reason that this pattern seems to hold? There isn't some basic law of nature that dictates this, but it is probably simply a likely coincidence given the variety of market failures that can, do, and will occur.

What all of this means is that do not let past performance, whether bad or good, influence your current decisions too heavily. After a decade (the 1990s) in which stocks committed acts of utter brutality against bonds, it was a mistake to invest in stocks that had an effective earnings yield of 2.5% when bonds had a yield of over 6%. Similarly, right now it probably doesn't make much sense to buy treasuries which have a yield of 2.5% when stocks have an earnings yield of... about 6%. Wait, what? That's weird how that happens isn't it?

Now that we have that out of the way, time to move on to the most recent relapse of the European disaster.

Sunday, August 29, 2010

The crazy(?) bond rally

Over the past four weeks or so, the bond rally has become truly epic. I have been truly stunned by the magnitude of it.

Here is the oft-mentioned TLT, which tracks the 20 and 30 year US Treasuries.

It's charted against SPY (the S&P 500 proxy) and EEM (the emerging markets proxy). To show that the bond rally has some breadth, let's look at municipal bonds as well. Now, the MUB is not just a long maturity municipal bond fund but rather a larger aggregate so its moves aren't as dramatic, but it tells a similar tale.
The same had also held with corporates, as represented by LQD, which tracks long term investment grade corporate debt.

Now, the question that many are asking is "Is this a bond market bubble?" Well, current interest rates do seem absurdly low. In terms of the stock market, it would be the equivalent of paying 40x earnings for a company's stock (the equivalent of a 2.5% earnings yield). However, with inflation also at historic lows, the bubble might not be as big as some are claiming. If you are of the view that inflation will soon accelerate to 4%+, then yes, bonds are dramatically overvalued. If you believe instead that inflation will be between 0% and 1.5%, the overvaluation of bonds ranges between not much and only marginally overvalued. I do happen to think that, when you look at comparative stock market measures, bonds are at least moderately overpriced. That holds true so long as corporations will be increasing their earnings even at a moderate pace over the next several years.

With the Fed possibly embarking on more quantitative easing (the direct purchase of treasuries to increase the money supply), one might wonder if interest rates will be capped at these low levels or even drop further. The last time the Fed did a similar action, interest rates rose anyway because market expectations of an economic recovery picked up. At this juncture, it's hard to say which way they will go, but I think that past performance might be a decent indication. Quantitative easing is a powerful stimulative tool and if the Fed is zealous in its application, it actually might actually have the net effect of increasing interest rates through market expectations of higher growth. All of this remains to be seen, however.

Sunday, August 22, 2010

Do Deficits Cause Crowding Out?

This is an age old question in economics and one that causes much debate. The basic idea in classical economic thought is that government deficits are not stimulative because they supplant private capital on a 1-1 or even worse basis. Now, this is a highly political debate as well in the current time period even though Democrats and Republicans are both heavily responsible for the current fiscal imbalances, but I digress on that point.

In any case, I am interested in studying the portfolio crowding out channel, which is simply the idea that more government paper on the market increases interest rates higher than they would have been otherwise. I have to confess that I have run a hideously simple regression to study the matter as a first approximation to see if anything is there at all. The basic design is this simple:

Dependent Variables: AAA 10-year corporate bond yields - 10 year treasury bond yields and BAA 10-year corporate bond yields - 10 year treasury bond yields
Independent Variables: Government deficit as % of GDP and a binary variable indicating financial crisis or recession

I am using these two credit spread measures because theoretical speaking the market for credit instruments is a layered one. Demand is highest for U.S. treasuries, next highest for AAA corporates, and lower for BAA corporates. As such, if crowding out exists, you would expect to see deficits cause spreads to widen for the corporate securities as more demand is satiated on the high end by the burgeoning supply of treasuries. Using credit spreads as opposed to nominal rates also deals with the problem of adjusting rates for inflation as it appears there is little effect on credit spreads from inflation. On a theoretical basis, we would expect to see rates on lower end corporates expand by more than on higher end corporates as they are the more marginal investment and would have to proportionately offer more in a situation where crowding out is occurring.

I ran this from 1954-2009 and got the following (I am putting the regression in plain English terms):

For AAA - 10 year treasuries:
For every 1% of GDP the deficit expands, AAA credit spreads expand 0.11%
The presence of a recession or financial crisis causes spreads to expand 0.52%
These two variables explain approximately 28% of the variation in credit spreads over the period of 1954-2009.

For BAA - 10 year treasuries:
For every 1% of GDP the deficit expands, BAA credit spreads expand 0.17%
The presence of a recession or financial crisis causes spreads to expand 0.84%
These two variables explain approximately 50% of the variation in credit spreads over the period of 1954-2009

All results were significant at the 95% and 99% significance levels.

Now, I should have probably used a GDP growth rate as opposed to a binary variable for recession or financial crisis, though that presented problems when attempting to model the presence of a financial crisis such as in 1998 or 1987. In the future I may use stock market performance and GDP growth. The problem with a great many of these variables is that they are heavily correlated with each other so that presents difficulties. For example, recessions and deficits are highly correlated, particularly in recent history.

What I think this shows is that deficits may, and I will emphasize may, have a small effect on corporate credit spreads, though there are likely other factors. For instance, the level of corporate bond issuance is not taken into account here and that would have a bearing on these measures. In the current market, corporate spreads have been narrowing to levels that would not be explained by the variables here and that could be because corporate issuance is so low that they are able to sell at low interest rates. Still, I was encouraged that the theoretical result did emerge here which is that we do see the stratified effect on corporate spreads.

As far as how to use this information, I think what it means is that you probably shouldn't worry too much about deficits' effect on corporate bond yields and by extension corporations' ability to borrow because deficits evidently explain quite little of the movement in credit spreads. I think the odds are considerable that if I had spent more than 15 minutes on this, the effects would have been even smaller.

Sunday, July 4, 2010

What do current bond yields and war bonds from WWII have in common?

They pretty much share the same interest rate. That's right. I calculated the effective compounded interest rate of war bonds sold during WWII to be 2.91% for a ten year instrument while current ten-year notes are trading at 2.98%. So, current market forces have pushed interest rates on government bonds so low that they're, well, downright patriotic allowing the government to borrow money so cheaply.

It makes me think of this WWII-era commercial for war bonds:


By the way, calculation was based on the following information. You could buy a bond that matured in ten years at $25 for $18.75. So, the calculation is ((25/18.75)^(1/10)) which is the good old fashioned compounded annual growth rate formula for those who are interested in such things.

Tuesday, June 29, 2010

What does a 2.95% yield on the 10-year mean?

Back before the world blew up in 2008, if ten-year treasury rates were much below 4%, I would say that you were either in a recession or a financial panic. Below 3%, I would have said that things must be pretty nasty right now. Well, I would say that the confluence of bad news out of Europe, China, and our own markets does indicate that conditions are fairly rough, but I think the more important signal is that there is absolutely not a chance of a major inflation outbreak. Indeed, 2.95% on the ten year indicates that we are either at 0% inflation or even have a mild case of deflation about to set in.

In either case, this is highly unusual and bears watching. My own suspicion is that investors are ridiculously risk averse, but the extent of the rally in bonds now has taken on a different life. It's hard to say for certain what such low yields portend.

Friday, June 4, 2010

Weekend Reading: Bonds a Bubble?

There has been a fairly consistent refrain for two years or even longer that treasuries may indeed be overpriced, meaning that interest rates are consequently too low on long term instruments. This interesting article from MarketWatch hits on this idea yet again.

One thing worth considering is what it would mean if the long term treasury market actually did go bust. What are the implications for your investments? Unfortunately, this is not a pleasant prospect and it leads to one wondering where exactly their money should go. I actually don't have any particularly firm answers on this front, to be quite honest, but maybe by talking it through we can uncover some possibilities.

So, let's just say for a moment that for one reason or another, long term bond prices suddenly collapse. This could be because of worries about the solvency of the U.S., suddenly higher inflation expectations, or much more attractive investments elsewhere. The last two are more like than the first. Basically, if investors either need to abandon the safety of treasuries to beat inflation or if they feel that other markets offer stable enough returns that they can leave their fortress of U.S. treasuries, bonds will rout. How vulnerable are bond prices to changes in long term interest rates? Well, if rates on the 10-year rose from 3.30% to 5.00%, a $1,000 investment in treasuries would turn into $866.86. Ouch.

Thursday, May 13, 2010

Asset Allocation: A Dynamic Model

There are many approaches to asset allocation and I will try to give them all justice in turn. However, as promised, I will unveil one approach that I worked on for several months designed to pull off a difficult task: Picking the precise moments to shift in and out of stocks.

The model relies on three basic indicators:

1. The spread between earnings yield on the S&P 500 Index and the yield on 10-year Treasury Bonds
2. The spread between 10-year Treasury Bond rates and 90-day T-bills (one measure of the slope of the yield curve)
3. The spread between AAA rated corporate bonds and 10-year Treasury Bonds

For the uninitiated, earnings yield is calculated in the following way for an individual stock:
(1/PE ratio)*100% = earnings yield

For example on a 25 PE: (1/25)*100% = 4% earnings yield

The basic logic for each indicator being included is as follows:

1. The earnings yield spread is a measure of the relative valuation between stocks and bonds. A wide spread indicates that stocks are undervalued while an inverted spread indicates that stocks are overvalued.

2. The yield curve measurement relies on the predictive power of the Treasury yield curve for predicting major economic cycles. A heavily upwardly sloped yield curve indicates that the market expects short rates to rise in the near term because economic growth, and therefore inflation expectations, will be rising. An inverted yield curve indicates the opposite.

3. The corporate credit spread measurement is a proxy for financial panic and complacency. A wide spread indicates that markets are skittish and investors will only buy corporate bonds at severe discounts to Treasuries. A narrow spread indicates the opposite. This is a contrarian indicator. It is specified to give favorable signals when things look frightening for corporate credit.

Without getting into too many specifics at this point, the model relies on a composite score of the three indicators to give signals of when to re-balance your portfolio. The more favorable the composite becomes, the more you should shift into stocks. The more it indicates unfavorable conditions the more you should shift into bonds. Fairly simple, though the calculations were a pain.

The model has upper and lower bounds for asset allocation of 80% and 20% meaning that neither stocks or bonds can ever be less than 20% of your portfolio. I may respecify this to allow for 100% allocations, but I am not sold on that idea yet.

Here's a chart of how one specification of this model allocates:

It may look very volatile, but bear in mind this is over 57 years and it is crunched into a single graph.

Now, the fundamental question is: How does this work in practice? Does it provide a high rate of return with high rates of stability?

Well, historically back tested it produces a compounded annual growth rate of 8.0% vs 7.0% for an all-stock portfolio over the same period. More importantly, it does this with a lower range of volatility. The annual standard deviation for returns is 8.6% for the model and 15.3% for an all stock portfolio. Graphically, it looks something like this (red line is all stocks, blue line is the model under the specification above):


The graph is in logarithmic terms because it provides a more accurate picture. As you can see, the model is still prone to some losses in severe market downturns, but on the whole it is more stable.

One challenge of the model is that it is subject to long periods of under-performance like any balanced portfolio. The trick to the model is that it makes up a lot of ground in bear markets because it correctly moves investors into a bond-heavy position just before major declines. It does move back into stocks too soon in 2008, but it does have investors fully invested at the bottom and in for the subsequent rally. In the bear markets of 2000-2002, 1990, 1981-82, and 1973-74 it performs very well indeed.

Of course, the future might not look anything like the past, but I think such an approach is promising.

What do you all think?

Btw, the model currently suggests an 80-20 stock/bond split.