Disclaimer

Opinions and observations expressed on this blog reflect the authors' individual experiences and should not be construed to be financial advice. None of the members of this blog are licensed financial advisors. Please consult your own licensed financial advisor if you wish to act on any recommendations here.
Showing posts with label Asset Allocation. Show all posts

Wednesday, May 7, 2014

Putting Riskier Assets Into Your Portfolio Stabilizes It?

Alright, that was a much longer hiatus than I would care to ever repeat and I decided to get back into the swing of things here by writing about one of my favorite little facts in portfolio theory. That is the peculiar fact that adding stocks to an all-bond portfolio actually stabilizes your returns and you get a higher return for less risk.

You know how economists always say there's no free lunch? Well, there's an exception to that rule and it comes from what is referred to as the "efficient frontier," which amounts to a rule about assessing the true relationship between risk and reward. Long story short, there isn't a straight linear relationship. There's a weird bend in the curve that makes a 27% stock portfolio as safe as a 0% stock, 100% bond portfolio and makes a 15% stock portfolio the least risky of all. For all of the charts below, I used data on total returns for stocks and 10-year U.S. from 1928 to 2013.


But wait, there's more! Because of the fact that adding stocks to a portfolio increases your long-term annual returns, this actually means that you can reduce your volatility and increase your returns in that backward-bending portion of the volatility curve. 


The idea that risk and reward are strictly linearly related has been a longstanding fallacy that most people buy into, but there are even every day exceptions to that. For example, you can walk into a street with cars going 25 mph and the odds are that they will stop and not run you over, even though they'll be incredibly angry with you for making them hit the brakes. However, they might not hit the brakes and then you'll be run over. The risk there is pretty high and the reward is saving a few seconds on your commute. 

The reason that it's not linear in the case of investments has to do with the fact that the factors which move stocks and bonds are different. Bonds typically do well in environments where investors are risk-averse and the outlook for inflation is declining, often because growth is declining. Stocks generally (surprise!) do well when growth prospects are strong. There are years where their interests coincide, very notably 1995 and 1982, because falling interest rates are good for bonds and stocks, all else being held constant. The consequence is a distribution of returns that looks something like this.


There's a smattering of about 8 years where they both do very well and you can see that in the upper-right corner, but otherwise there's a decently strong inverse relationship between the two.

So, the conclusion here is that by introducing a riskier asset class, in this case stocks, into a portfolio that starts as 100% bonds, you actually reduce your long-term volatility and increase your returns at the same time.

Now, a related question is what allocation avoids the worst performance historically. The answer isn't quite the same, but it's close. 


It works out that an 11% asset allocation to stocks has had the smallest 1-year decline of any asset allocation at just over a 7% drop. This of course prompted the question of what is the best year each asset allocation has seen. There's no question that 100% stocks will see the best year, but the rest of the curve is kind of interesting.


I know it's a little spooky, almost like Quantum Entanglement, but facts are facts and it's important to know what asset allocations are truly best for reducing volatility if that's your preference.

In case you're curious about the history of this idea, Harry Markowitz, one of the all-time greats in financial economics, was the one who really popularized it. 

With that, it's good to be back and I hope to be posting more in the future.

Tuesday, July 5, 2011

July 2011 Asset Allocation Model Update

As has been the case for well over a year now, the asset allocation model that I built and have been tracking for quite some time indicates that a split of 80/20 stocks vs. bonds is still called for in these circumstances.

Though valuations on an absolute basis are not as attractive as they were at this time last year, the slope of the yield curve, combined with very low interest rates continue to provide a strong case for equities. If you look at the past year and a couple of months since we inaugurated it, I think it has been generally correct, though it has been limited to recommending an 80% equity asset allocation:

Since the beginning of the tracking period, the S&P 500 has outperformed long-term bonds by about 1500 basis points. There was a stretch in the summer of last year that I regretted that the model could only go to 80% stocks since the readings were off the charts recommending buying equities. Part of the reason the model has been stuck at 80% in stocks for so long is that it shot so far above the threshold that even though it has since come down somewhat, it is still over the line for 80% in stocks. I may refine the model somewhat to allow for rare cases where you should go "all in" because there are a number of times in the history of the financial markets where that is called for. Conversely, there are times where having just about no equities also makes sense. This, however, is not one of them.

The bottom line is that the comparative case for allocating your money to equities and away from fixed income instruments is very very strong right now.

Thursday, March 10, 2011

More Nonsense About Public Pensions

http://www.nytimes.com/2011/03/11/business/11pension.html?src=busln


What follows does not represent the views of the State of Wisconsin, the Department of Administration, or the State Budget Office. 


Let me be blunt. Joshua Rauh, the Northwestern University professor behind nearly all of the scare-mongering on public pensions, is a malignant tumor and a fairly heavily metastasized one at that. His basic premise has been that public pensions are much more poorly funded than they look because they use unrealistic assumptions about rates of return. He claims that you should use a risk free rate of return, rather than a balanced portfolio's rate of return (historically nearly 8%), to discount future pension liabilities. For the uninitiated, discounting future liabilities at a lower interest rate makes your future liabilities a good deal larger. 


His real claim to fame was an article he published, along with a University of Chicago professor, at the pits of the stock market's decline in the most recent bear market where assets of the pensions funds were measured at fair market value (artificially depressed by nearly 50%) and compared it to liabilities discounted using 10-year treasury rates at the time (roughly 3.5%). I'm not actually sure that I need to explain what is wrong with this, but I will anyway because it actually offended me. In essence, what he did was take an artificially depressed portfolio and then assume an artificially low return from an artificially low level and say "My God! These things are horribly underfunded!". I would actually be curious what the fair market value measures would look like right now.


In any case, we all know that the assets of these funds have recovered sharply. That is evident in the Federal Reserve's Flow of Funds Report. Since Q1 2009, the assets of state and local government pension funds have recovered nearly $800 billion, or over 35%. What is more troubling is his bizarre assertion that pension liabilities should be discounted at a risk free rate of return. My simple response is: Why? That actually makes no sense. Why should long term assets be discounted at a rate that would only make sense if we expected to need them at short notice? His choice quote is “If you don’t want to count on the stock market to pay for all this, this is what you’re going to have to contribute.”. All I have to say is "Huh?!".


I wonder what the "unfunded liabilities" of 401(k)s look like if you compare current balances to future liabilities (i.e. your retirement expenses) if you discount them back at 10-year treasury rates. They are absolutely dependent on stock market returns after all. All of these plans rely on the stock market. Nothing else provides the returns reliably enough (yeah, I know what the response to this is). No person earning up through an upper middle class income could possibly afford to save enough through fixed income securities, even if they lived like a monk. If Rauh was honest, that's what he would say, but he doesn't. 

Friday, December 31, 2010

Year End Asset Allocation Model Update

I just realized that I hadn't done one of these in about two months, but the model still just barely puts allocation at the 80% equity/20% bond split that it has since May. I will point out that the model has consistently described a positive environment from stocks and even with the summer sell-off, this has clearly been the right call in a macro sense. That being said, the signals are not as overwhelmingly bullish as they were in the summer after interest rates dropped through the floor while stocks took a 15%+ hair cut.

The aggregate composite indicator on which the allocation percentages are based was off the chart this summer in a way it had not been since March 2009 and in some respects it even exceeded those levels. Since then it has come down, though we are still in very bullish territory.

Based on this and a series of positive economic indicators, I think I very solid case can be made for a good stock market for at least the next six months barring a full-blown financial collapse in Europe, which is a possibility.

Happy New Year, and I am glad that we can end on a positive note.

Sunday, November 7, 2010

QE and the Macro Climate for Stocks, Bonds, and Commodities

Since the Fed has decided to further monetize the debt in bid to try even more monetary stimulus, a few things are clear. One is that the Federal Reserve is absolutely nowhere near tightening and won't be for many months to come. That should be no surprise considering the size of the present shortfall in employment. The other is that the dollar looks like an extremely unfavorable investment right now, meaning that foreign stocks are comparatively more attractive in the interim as the supply of dollars will increase greatly as well as the fact that US interest rates will do a poor job of attracting fixed income investments. Foreign investors holding dollar denominated investments better watch out.

One thing that is abundantly clear is that financial markets have interpreted this Fed action as an all clear signal and everything from gold to Goldman Sachs (GS) has joined in. We are not in bubble territory in the stock market, though we are almost there in some, though not all, commodities markets. Those who are using commodities as a substitute for investing in financial assets in times of loose monetary policy continue to push those assets further and further from their fundamental values. There is no need to be worried about a bubble being fueled in the real estate markets. Those are so far deflated that no amount of monetary or fiscal stimulus could re-inflate them because investor expectations of returns have been so brutally throttled.

In the short run, meaning the next few weeks, I would not be stunned to see some retracement of recent gains on the order of as much as 5% in domestic stock markets. However, the next 12 months or so should be quite good. Earnings growth for the time being is strong and interest rates will not be a headwind. Commodities markets are probably a better than even shot to outperform in this environment as this global distrust of "paper" currencies seems to really be hitting a frenzy. However, once this current period of extremely loose policy relents those investments will crack much worse than the equity markets in the aggregate because there is much less of a link to fundamental value.

Stocks are supported by extraordinary levels of corporate profitability that make overall valuations quite reasonable. This is due in no small part to the current levels of slack in the labor markets that allow corporations to enjoy a larger share of productivity gains without passing them along as wage increases. However, lack of investment in both human and physical capital means, to a large extent, that corporations are cannibalizing future earnings for current earnings. Invariably this means that future earnings growth will be relatively muted as corporations need to hire and expand plant and equipment to grow sales as conditions normalize. That will prove to have a dampening effect on the later stages of the present rally.

Bonds, on the other hand, are currently being supported by Fed purchases, but this obviously will wear off, particularly as investors in long term bonds become frustrated by their low rates of return compared to high rates of return elsewhere. As such, prices will fall and yields will rise, possibly considerably. Long term treasuries are thus not a particularly good place to be.

Now, all of this is just my own opinion, which in no way constitutes professional advice, and I could certainly be wrong as I have been in the past. Still, it seems to me that this represents a fair summary of where we are right now.

Sunday, October 3, 2010

Asset Allocation Model and Rebalancing

There are some thrilling Sunday conversation topics for you.

In any case, I realized that I neglected to post what the asset allocation model said for September. Suffice it to say that it still points toward the same 80/20 split in favor of equities that it has since we have been modeling it. However, after the increase in stock prices in September and a slight narrowing of corporate credit spreads, the overall score wasn't quite as strong. Remember that the model has minimum asset allocations of 20% bonds or equities no matter how favorable the indicators become for one asset class or another.

In any case, now might be a good time to discuss that even with fixed asset allocations like this there are some nuances that you have to take into account regarding re-balancing. If you rebalance every month where you assess your actual allocations compared to the targets, a result many don't think of is that, even with static asset allocations, you do end up accumulating more of the underperforming asset class at its bottom. I've actually gotten some confused looks from people on this point so I will explain it in a clear example.

For example, let's say that you have $100,000 (most of us wish) split 80/20 stocks and bonds respectively. In the course of three months, the stock portion of your portfolio loses 25% and the bond portion rises 10%. You will have a total of $82,000 split $60,000 stocks and $22,000 bonds. Inadvertently, bonds have become about 27% of your portfolio. In order to bring your portfolio back into the proper balance, you take $5,600 out of your bonds and put it into your stock positions to restore your target weightings. In this way, even when your portfolio takes an overall beating due to possibly being overexposed to equities in a bad stretch for them you still buy in at the lows even though it would otherwise appear that you can't commit any more to equities. This isn't exactly a shocking revelation, but it is one that some people don't think of.

Now, if you have a $5,000 portfolio or even a $10,000 portfolio as opposed to a $100,000 portfolio, the transaction costs involved here probably either come close to or entirely eliminate the gains from very frequent rebalancing. If you rebalance every month, you have two transactions at $10 a piece for $240 in a year, not to mention the capital gains you might accumulate in the process. This is one persistent problem for smaller portfolios versus larger ones which is that you are more wedded to individual investment decisions due to a lack of flexibility in getting out of them.

Tuesday, September 14, 2010

Another Take on the "Bond Bubble"

Here's a somewhat more well supported take on the bond market from Angry Bear than what you'll see most places. His model suggests that bonds are properly valued at the moment and were actually somewhat cheap not that long ago. I haven't looked much into his model yet to see if there's something I disagree with in there, but given levels of GDP growth and inflation, it could well be that present bond prices aren't that overvalued.

I don't happen to buy into the thesis that bonds are a bubble in the same way that stocks were in 1999 or housing was in 2006. I think they are only modestly overvalued on an absolute basis, but they are very unattractive to stocks at the present time. Let me put it bluntly. Do you think that the total return of bonds, which will be the present yields at best considering prices are likely to drop as interest rates rise, will exceed that of stocks over the next five or ten years? Even after adjusting for the relevant risk premiums, stocks are quite a bit more attractive than bonds at the moment.

Tuesday, September 7, 2010

Shell Shocked Into Stupidity

Steve was kind enough to forward me this Newsweek article while I was at work today and now I feel the need to share it. http://www.newsweek.com/2010/09/07/young-adults-invest-conservatively-post-recession.html

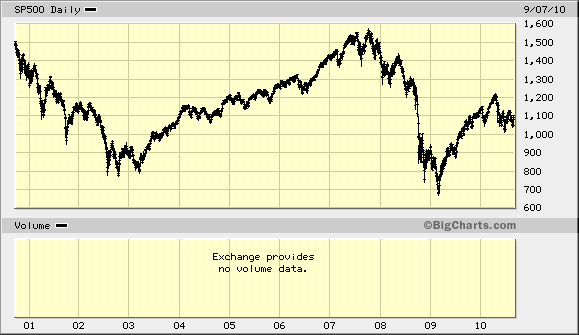
I have actually witnessed this among some in my age cohort (I just turned 24). I think I can speak fairly well on behalf of my generation when I say that we have not known a good investing climate. I mean, look at it:

That's the S&P500 over ten years and now financial advisors expect my generation, a very cynical and disillusioned lot to start with, to believe that things always do well "over the long term". I know people, and I won't name names, that honestly believe that the best thing you can do with your money is pile it ever higher into government bonds. They have been shell shocked by the grind of the financial version of The Somme into fairly morbid stupidity. Well, I suppose they are chasing performance since treasuries have absolutely butchered stocks over the last decade. However, I also remember after the last major bear market when a couple of my friends in high school told me that the only asset to invest in was "land", trying to evoke an air of nobility about their investments. How did that turn out?

I've been investing, with varying degrees of success, for this period and only this period. I've known nothing else but this horrible market, but it hasn't phased me because, if you are careful, there are winners among the carnage. Also, and this is much more important, it is important to realize that this last decade was somewhat anomalous for two major reasons: 1. The late 1990s bubble and 2. The housing bubble and the subsequent meltdown. Stocks came into the decade about, oh, 40% overvalued. The 1990s would have been a perfectly fine decade in absence of the last major run up, but it got out of hand for a number of reasons I am in the process of writing about for another post. Then of course we had the most serious financial crisis, well, ever since the Great Depression was actually more of a real economic contraction that caused a self-reinforcing financial crisis than the other way around, which is closer to what happened this time.

Admittedly, these sorts of events are not that uncommon in the context of financial market history. Indeed, bad decades (or similar intervals) seem to occur nearly one in every three for the period in which we have modern data. Is there any reason that this pattern seems to hold? There isn't some basic law of nature that dictates this, but it is probably simply a likely coincidence given the variety of market failures that can, do, and will occur.

What all of this means is that do not let past performance, whether bad or good, influence your current decisions too heavily. After a decade (the 1990s) in which stocks committed acts of utter brutality against bonds, it was a mistake to invest in stocks that had an effective earnings yield of 2.5% when bonds had a yield of over 6%. Similarly, right now it probably doesn't make much sense to buy treasuries which have a yield of 2.5% when stocks have an earnings yield of... about 6%. Wait, what? That's weird how that happens isn't it?

Now that we have that out of the way, time to move on to the most recent relapse of the European disaster.

Friday, September 3, 2010

Another View on Interest Rates and PE Ratios

In the interest of fairness, here is a view saying that comparing interest rates and PE ratios is a useless exercise: http://www.marketwatch.com/story/are-stocks-really-undervalued-2010-09-03?dist=beforebell

I have several issues with the way the study was conducted as it seems a painfully simply regression analysis for a firm that specializes in it. What I found in my own research was that periods of a big positive spread between earnings yield and interest rates correlated very highly with periods before a major bull market and the inverse was also true. There was one period where this relationship broke down badly which was the 1990s, but that was the only one I could find.

I will do my own regression along the lines of the way they designed it and try to figure out how they came up with what they did because my knowledge of the data does not seem to support the notion here. Now, they used real rates of return against nominal comparisons of PE ratios and interest rates, whereas I kept everything in nominal terms.

Sunday, August 15, 2010

Dynamic Asset Allocation Model: August Update

I had hoped to do these on a more regular schedule, but life has not been particularly permitting on that front. In any case, the August Dynamic Asset Allocation Model suggests an 80% weighting for equities going forward. Of course, this is the same as it has been since pretty much the end of 2008 with a few small twinges back and forth here and there.

However, August did see some interesting movement in a couple of the indicators. The yield curve measure moved down as ten year rates have continued to come in. Corporate spreads also narrowed in August, suggesting looser credit conditions for corporations, which is bearish for the model due to the contrarian intention of the indicator. The overall model remains very bullish because the earnings yield metric is at levels similar to the early 1950s as well as the bottom in 1974, which is immensely bullish for stocks.

Still, this model was based on historical patterns and a deflationary environment would ruin some well established historical relationships on which investors have relied. Principally, in our discussions of PE ratios we talked about how PE ratios work because there is the implicit assumption that earnings in the future will be higher. In a deflationary environment this isn't the case. As such, keep your eyes peeled. I still think that stocks are quite cheap on a historical basis relative to alternative investments, but it isn't as unqualified as the indicators in the model would suggest. 


End of the Brief Hiatus and on to the Deflation

Now that I have finally moved into my new abode I can recommit myself to blogging.

A general issue that I have talked to a number of people about is what to do in the event that there is persistent and nagging deflation in the economy. I will say that the one good part about the onset of deflation in the variety that we see in Japan is that you have plenty of time to recognize it before the market actually punishes you for missing it. It isn't as though "the market" wakes up one day and goes through this logical exercise "IF CONDITIONS = "DEFLATION" THEN "40% SELL OFF"".

One will have ample time to first recognize the onset of persistent deflation and then adapt policies to it. I would say that we are seeing definite signals in the equity and credit markets that market participants are quite concerned about the prospect of slow and grinding deflation. With the 10-year at approximately 2.7% and stocks seemingly rangebound, we may be getting some early signals, but there is no sense in acting harshly on this as the effects of equity and credit markets are gradual enough to allow for a very thoughtful and gradual reallocation. As of right now, as the dynamic allocation model will show when I update it later today, a healthy allocation to equities is still warranted.

Saturday, July 17, 2010

Quick Update of Dynamic Asset Allocation Model

The model still suggests an 80% allocation to equities in the current environment. Despite the contraction in the yield curve, the expansion of the earnings yield measure and corporate credit spreads added more than the narrowing in the yield curve took away.

On a fundamental basis, this allocation makes sense for entirely another reason. The dividend yield on the S&P 500, forgetting earnings for a moment, is just shy of 2%, so you are only giving up 1% on 10-year treasuries just there. Among those stocks that are actually paying dividends right now, the average yield is 2.54%. Further, these numbers are depressed by the fact that almost all financial stocks, normally payers of robust dividends, have pulled back over the past two years to pay virtually nothing. Case in point, JP Morgan Chase (JPM) was once a payer of a 4% dividend or better, but in order to preserve capital during the financial crisis it put that down to 0.5%.

With such a narrow differential between bonds and stocks in terms of income generation, it doesn't make long term sense to be heavily in bonds at the moment. From a trading perspective, it varies, but for those without sufficient cash to trade, it makes the most sense to be heavily in equities in the present situation.

Tuesday, June 15, 2010

The Peculiar Allure of Gold

Anyone who knows me knows that I have a pathological hatred of precious metals so take that into account when I delve into a brief discussion of gold. Let me first get something out of my system by saying that, in my view, metals should only be valued by their relative rarity and usefulness in industrial purposes. At an emotional level, to me, not much else makes sense, but I digress.


In any event, gold has been the investment of the last decade, unless of course you invested in overseas stock markets. Brazil from the lows of 2002 kicked the hell out of gold. "Kicking the hell out of" something is a technical investment term used to discuss relative performance. Yes, it is true that gold blew away stocks in a bad way in the 2000s. Its proponents point to a few attributes that gold has that explain this performance. These are, namely:

1. Gold is the ultimate inflation hedge. Your money will not lose value if it is invested in gold.
2. Gold is the ultimate crisis hedge. When people get scared, they buy gold.
3. Gold is the ultimate hedge against a falling dollar. When people lose faith in "fiat" money, they will turn to gold.

Proponents argue that these are all absolutely immutable laws of the market and that these relationships always hold. In fact, some argue that there is a strict mathematical relationship.

Of these arguments, only the third really holds any water for me, and even that I am slightly skeptical of. Let me address these in order.

More after the page break.

Thursday, June 3, 2010

Dynamic Asset Allocation Model: May Update

I will continue to provide monthly updates for the dynamic asset allocation model I outlined in an earlier post because the only real way to see what a model is made of is to test it in real time. Let's see what happened in May.

Using monthly closing numbers for the S&P 500, Ten Year Treasury, 90-day T-Bill, and Aaa 10-year Corporate Bond, the model suggests a continued heavy weighting toward equities at the maximum of 80%. Now, of course it suggested 80% before the bottom fell out of the market last month too, but the interest rate measures are largely designed to suggest the relative economic value of stocks and bonds and not to forecast crises. 

Due to the fall in the S&P 500 and 10-year interest rates, the earnings yield measure improved noticeably. Corporate credit spreads widened, also putting upward pressure on the equity allocation. The one negative is that the yield curve noticeably flattened, virtually entirely a function of the fall in ten year interest rates. However, the overall composite score for the model on which the asset allocation is based reached one of its highest levels in the 1954-2010 period. In other words, if I let the model fluctuate up to 100% allocations in either stocks or bonds, it would be pretty damn close to 100%. 

Frankly, this makes sense given where interest rates are right now. Bonds simply are not attractive relative to stocks at these interest rates given the recovery in corporate earnings. In the short run, as a crisis play, they have made sense, but remaining in treasuries for too long will wipe out those gains because 3.3% long term rates are not going to stay.

Take it or leave it. This is not professional investment advice, but this approach continues to suggest a high weighting toward stocks.


Thursday, May 27, 2010

Threading Strategies Together

Several different strategies have been discussed here on Finance Monitor along with numerous individual investments and I thought I would provide some context on how to view the discussions in the context of your own investments. The fundamental goal of this post is to weave several different posts on different subjects together. I will try to provide links so that you can quickly look up the prior discussions.

I guess the proper way to start this conversation was with the prior post on risk reduction in portfolio construction. This is one way of looking at your macro strategy, though there are many potential variations on this broader strategy. Within the core portfolio, either use equity index funds or balanced funds and basically just try to keep your overall allocation right, unless you want to be a little more active here. Then, you can engage in what was discussed on the post on dynamic asset allocation.

To do this, use the SPY and TLT ETFs at a basic level. If you have less than $2,000, I strongly encourage you to only re-balance when interest rates suggest you make a large reallocation from stocks to bonds or bonds to stocks. If you re-balance with every twinge, you'll get eaten alive by commissions. For example, let's say the model changes each month and you re-balance with $7 commissions each time (on both purchase and sale) with a $2,000 balance. You will incur $14 a transaction 12 times for a total of $168 in commissions. That would be 8.4% of your portfolio or greater than your average annual gain. With $20,000, it's 0.84%, which is bad, but not ruinous. If you are so fortunate to get up to $100,000, the fees are very low indeed. The ETF fees for TLT and SPY are also very low. In the case of SPY they are 0.09% per year and 0.15% on TLT.

Sunday, May 23, 2010

"In Defense of the Humble Balanced Portfolio" - Morningstar

I stumbled across this good article from Morningstar "In Defense of the Humble Balanced Portfolio". This relates to a previous discussion on overall investment strategies and several subsequent posts on asset allocations and portfolio construction.

Incidentally, they do note some shortcomings of a simple static 50/50 stock and bond mix, or any static ratio for that matter, which is what prompted me to work on the dynamic asset allocation model over the past year or so. Even the automatic rebalancing target date funds have their problems as they rebalance at linear rates that may not be opportune given market cycles. That's why I prefer the dynamic, interest rate signal approach.

What do you all think?

Thursday, May 20, 2010

Strategy Sessions - Part 2: Building Your Portfolio to Protect Your Assets

As I have previously mentioned, there is somewhat of a trade off between the potential, and I will emphasize potential, for high returns and the volatility that you will incur. This relationship is not absolute as, for example, adding some stocks to an all bond portfolio actually reduces your volatility over time. However, it is a fair starting point for considering how to construct your portfolio. All of the following is based off of my own personal views and does not necessarily represent "best practices" in the industry.

Regardless of your volatility preferences, any portfolio should start with a core position or positions. Depending on how much you have to invest and whether or not you meet investment minimums, this position can either be an broad market index fund (S&P 500, Wilshire 5000, or something that tracks a global index like the FTSE All World Index) or a similar ETF. Balanced funds (a mix of stocks and bonds) are also a good choice for core portfolio holdings. If you don't meet minimum investment requirements from your desired mutual fund (ie Vanguard often has a $3,000 minimum), then I say go the ETF route. You also will have greater flexibility in changing ETFs than you will with conventional mutual funds. Just keep an eye on fees. For a small portfolio (<5,000), core positions should be the bulk of what you have. For larger portfolios, core positions can be as little as 25%, in my view.

A quick aside, on fees, you should never pay loads (up front fees) on your mutual funds and keep an eye on expense ratios. If you are paying over 0.80% in annual fees, reconsider your position. Just a .40% differential on fees can cost you 16% in long term returns. Put another way, if you would have had $100,000 in your fund at retirement, you will have $84,000. You want those extra $16,000, so keep your eye on fees.

The next layer of your portfolio can venture out a bit into more volatile, but not crazy investments. Along the fund route, these are things like sector funds that track individual market sectors you think will do well, or broad basket emerging market funds or their equivalent ETFs (EEM, for example). This can also be composed of a basket of positions in various blue-chip companies if you choose to use individual stocks. If the core portfolio is your castle, this is your outer wall. I don't know exactly what to call this, so I will go with meso-portfolio. You have your core portfolio, then your meso-portfolio. I like the scientific sound of it.

From there, you can build your exploratory positions. These can be specific country or region emerging market funds, mid and small cap stocks (provided that they have decent analyst coverage), and so on. The larger your portfolio, the larger these positions can be.

Thursday, May 13, 2010

Asset Allocation: A Dynamic Model

There are many approaches to asset allocation and I will try to give them all justice in turn. However, as promised, I will unveil one approach that I worked on for several months designed to pull off a difficult task: Picking the precise moments to shift in and out of stocks.

The model relies on three basic indicators:

1. The spread between earnings yield on the S&P 500 Index and the yield on 10-year Treasury Bonds
2. The spread between 10-year Treasury Bond rates and 90-day T-bills (one measure of the slope of the yield curve)
3. The spread between AAA rated corporate bonds and 10-year Treasury Bonds

For the uninitiated, earnings yield is calculated in the following way for an individual stock:
(1/PE ratio)*100% = earnings yield

For example on a 25 PE: (1/25)*100% = 4% earnings yield

The basic logic for each indicator being included is as follows:

1. The earnings yield spread is a measure of the relative valuation between stocks and bonds. A wide spread indicates that stocks are undervalued while an inverted spread indicates that stocks are overvalued.

2. The yield curve measurement relies on the predictive power of the Treasury yield curve for predicting major economic cycles. A heavily upwardly sloped yield curve indicates that the market expects short rates to rise in the near term because economic growth, and therefore inflation expectations, will be rising. An inverted yield curve indicates the opposite.

3. The corporate credit spread measurement is a proxy for financial panic and complacency. A wide spread indicates that markets are skittish and investors will only buy corporate bonds at severe discounts to Treasuries. A narrow spread indicates the opposite. This is a contrarian indicator. It is specified to give favorable signals when things look frightening for corporate credit.

Without getting into too many specifics at this point, the model relies on a composite score of the three indicators to give signals of when to re-balance your portfolio. The more favorable the composite becomes, the more you should shift into stocks. The more it indicates unfavorable conditions the more you should shift into bonds. Fairly simple, though the calculations were a pain.

The model has upper and lower bounds for asset allocation of 80% and 20% meaning that neither stocks or bonds can ever be less than 20% of your portfolio. I may respecify this to allow for 100% allocations, but I am not sold on that idea yet.

Here's a chart of how one specification of this model allocates:

It may look very volatile, but bear in mind this is over 57 years and it is crunched into a single graph.

Now, the fundamental question is: How does this work in practice? Does it provide a high rate of return with high rates of stability?

Well, historically back tested it produces a compounded annual growth rate of 8.0% vs 7.0% for an all-stock portfolio over the same period. More importantly, it does this with a lower range of volatility. The annual standard deviation for returns is 8.6% for the model and 15.3% for an all stock portfolio. Graphically, it looks something like this (red line is all stocks, blue line is the model under the specification above):


The graph is in logarithmic terms because it provides a more accurate picture. As you can see, the model is still prone to some losses in severe market downturns, but on the whole it is more stable.

One challenge of the model is that it is subject to long periods of under-performance like any balanced portfolio. The trick to the model is that it makes up a lot of ground in bear markets because it correctly moves investors into a bond-heavy position just before major declines. It does move back into stocks too soon in 2008, but it does have investors fully invested at the bottom and in for the subsequent rally. In the bear markets of 2000-2002, 1990, 1981-82, and 1973-74 it performs very well indeed.

Of course, the future might not look anything like the past, but I think such an approach is promising.

What do you all think?

Btw, the model currently suggests an 80-20 stock/bond split.

Wednesday, May 12, 2010

Strategy Sessions- Part 1: Overview of Asset Allocation Versus Individual Securities

Steve brought up an interesting fundamental debate that investors have to resolve in their own heads: Should I be a stock picker or should I focus on asset allocation?

To put my own chips on the table here, I do both. Yes, it's a cop-out, but at the same time there is some value in it. Spreading your bets around not only different securities, not only around different asset classes, but even among different strategies does reduce the possibility of catastrophic loss and that is one of the chief objectives that any individual must bear in mind when making investments. Part of the reason I pick individual securities is that it simply keeps me interested in the market. The other reason is that I firmly believe that, with a good research methodology based on the fundamental value of companies, you can beat the market. However, I made my peace with the idea that I will not always beat the market and a lot of people do not come to terms with that.

As to the issues regarding picking individual securities, you must have a stomach of steel to handle the volatility. I own upwards of 18 different stocks at any one time so a large move in any one of them does not usually phase me. However, this sort of environment is not appropriate for many people for any number of reasons. Quite frankly, there is nothing wrong with being uncomfortable with high levels of volatility. It's a natural human reaction. If you do not feel able to keep up with the pace of the market, I would recommend broader strategies that focus more on asset allocation. Quite frankly, there is a damn good chance you will actually do better than being a trader or a stock picker. There's a great deal of evidence from economists and financial historians to support that idea.

To that end, I have devised a dynamic asset allocation tool designed to allocate into appropriate levels of stocks and bonds based on credit market indicators. The basic theory is that credit markets give indications of when you should get in and out of the market. I have always believed, with substantial empirical research from countless economists to support this belief, that interest rates are vital market signals and that relationships between different interest rates and those interest rates versus equity prices can be valuable investing tools. The model I have worked on will need revision as time goes on, but I think the general premise is solid.

In a few future posts related to this broader subject I will:
1. Discuss the dynamic asset allocation model introduced here
2. Outline some reasons why some individual stock holdings may be more subject to volatility than others
3. Introduce some methods for reducing volatility while still leaving open possibilities for gains
4. Whatever else I might think of

I'm doing this somewhat backwards because I am actually somewhat giddy to share the dynamic asset allocation model.

Saturday, May 1, 2010

Treasuries vs. Equities - Round 1

The reason I put "Round 1" here is that this will be an ongoing battle that changes with market conditions. As of right now, I would agree with the general sentiment expressed in this article from Seeking Alpha that long term treasuries are a poor place to be at the moment, with an important caveat.

If the Greece situation continues to spiral with little hope of a firm solution, long term treasuries are just about the best place to be. Every time Greece flares up slightly, treasuries have rallied. If there was a protracted debt crisis in Europe, capital would flee the Euro Zone and make its way to the U.S. and seek the safety of government paper.

If you have a modest long term treasury position, as I do myself, I don't see the pressing need to sell. If you have been moving vast amounts into bonds over the past few months, I question the wisdom of that decision. As long rates move up, which they will barring another major financial panic, you will lose money for the next couple of years. In short, your equity position should dramatically outweigh your bond position going forward for a while yet.

The article also addresses an important point about equity valuations which is that there are several ways to look at them. There is the absolute view that, for example, a price to earnings ratio (PE) for the S&P 500 of 20 is high. There is also the relative view which is that a PE of 20 in the context of a 3.70% ten year treasury rate is actually quite modest. Then, of course, there is the fundamental question of which measure of PE to use. Do you use the 12-month trailing earnings number? Do you use operating versus net earnings? Do you use a ten year trailing average of earnings as Robert Shiller does? Do you use the estimates for the next year?

I will address these differences next week in a larger post on how to value equities (an art I am still working on). Of course, you could just take that view that whatever the market pays for a stock is appropriate because all actors are rational and there is perfect information. It makes life easier... until you lose all of your money.