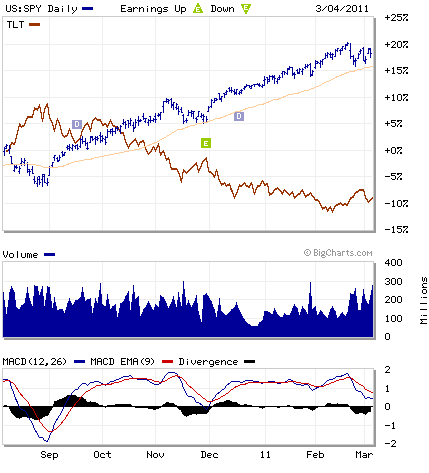
As has been the case for well over a year now, the asset allocation model that I built and have been tracking for quite some time indicates that a split of 80/20 stocks vs. bonds is still called for in these circumstances.
Though valuations on an absolute basis are not as attractive as they were at this time last year, the slope of the yield curve, combined with very low interest rates continue to provide a strong case for equities. If you look at the past year and a couple of months since we inaugurated it, I think it has been generally correct, though it has been limited to recommending an 80% equity asset allocation:
Since the beginning of the tracking period, the S&P 500 has outperformed long-term bonds by about 1500 basis points. There was a stretch in the summer of last year that I regretted that the model could only go to 80% stocks since the readings were off the charts recommending buying equities. Part of the reason the model has been stuck at 80% in stocks for so long is that it shot so far above the threshold that even though it has since come down somewhat, it is still over the line for 80% in stocks. I may refine the model somewhat to allow for rare cases where you should go "all in" because there are a number of times in the history of the financial markets where that is called for. Conversely, there are times where having just about no equities also makes sense. This, however, is not one of them.
The bottom line is that the comparative case for allocating your money to equities and away from fixed income instruments is very very strong right now.
Disclaimer
Opinions and observations expressed on this blog reflect the authors' individual experiences and should not be construed to be financial advice. None of the members of this blog are licensed financial advisors. Please consult your own licensed financial advisor if you wish to act on any recommendations here.
Showing posts with label Asset Allocation Model. Show all posts
Tuesday, July 5, 2011
Sunday, March 6, 2011
Asset Allocation Model Update - March 2011
Since we have seen a particularly large run up following the last update of the asset allocation model, I thought it would be wise to assess what it is currently saying while the market seems to have stalled for a bit under the weight of both its own advance and a spike in oil prices due to the Middle East coming apart at the seems.
While the allocation signal has shifted slightly away from stocks, it has not yet crossed the threshold to indicate that you should start moving into bonds. Part of the reason it has not yet shifted from the 80/20 split that we have seen for more than a year is that bonds yields became so depressed that they still have not normalized even after a serious drubbing since August. Bear in mind, this model is not necessarily a predictor of stock market returns in the aggregate, but rather where you should be positioned in stocks vs bonds. As of right now, it is still giving very favorable readings for stocks, though not nearly as favorable as in the summer of last year.
Incidentally, in July and August of last year, the model registered some of the strongest positive readings for a heavy stock allocation that the model has ever produced. Indeed, the reading given was just as strong as in March of 2009, indicating that stocks were poised to dramatically outperform bonds.
It is gratifying to know that the big call has panned out correctly, especially since things looked a little hairy at the lows there. Barring dramatic global upheaval, which isn't a great bet these days, I would expect stocks to continue to modestly outperform bonds from now through the end of the year.
Friday, December 31, 2010
Year End Asset Allocation Model Update
I just realized that I hadn't done one of these in about two months, but the model still just barely puts allocation at the 80% equity/20% bond split that it has since May. I will point out that the model has consistently described a positive environment from stocks and even with the summer sell-off, this has clearly been the right call in a macro sense. That being said, the signals are not as overwhelmingly bullish as they were in the summer after interest rates dropped through the floor while stocks took a 15%+ hair cut.
The aggregate composite indicator on which the allocation percentages are based was off the chart this summer in a way it had not been since March 2009 and in some respects it even exceeded those levels. Since then it has come down, though we are still in very bullish territory.
Based on this and a series of positive economic indicators, I think I very solid case can be made for a good stock market for at least the next six months barring a full-blown financial collapse in Europe, which is a possibility.
Happy New Year, and I am glad that we can end on a positive note.
The aggregate composite indicator on which the allocation percentages are based was off the chart this summer in a way it had not been since March 2009 and in some respects it even exceeded those levels. Since then it has come down, though we are still in very bullish territory.
Based on this and a series of positive economic indicators, I think I very solid case can be made for a good stock market for at least the next six months barring a full-blown financial collapse in Europe, which is a possibility.
Happy New Year, and I am glad that we can end on a positive note.
Sunday, October 3, 2010
Asset Allocation Model and Rebalancing
There are some thrilling Sunday conversation topics for you.
In any case, I realized that I neglected to post what the asset allocation model said for September. Suffice it to say that it still points toward the same 80/20 split in favor of equities that it has since we have been modeling it. However, after the increase in stock prices in September and a slight narrowing of corporate credit spreads, the overall score wasn't quite as strong. Remember that the model has minimum asset allocations of 20% bonds or equities no matter how favorable the indicators become for one asset class or another.
In any case, now might be a good time to discuss that even with fixed asset allocations like this there are some nuances that you have to take into account regarding re-balancing. If you rebalance every month where you assess your actual allocations compared to the targets, a result many don't think of is that, even with static asset allocations, you do end up accumulating more of the underperforming asset class at its bottom. I've actually gotten some confused looks from people on this point so I will explain it in a clear example.
For example, let's say that you have $100,000 (most of us wish) split 80/20 stocks and bonds respectively. In the course of three months, the stock portion of your portfolio loses 25% and the bond portion rises 10%. You will have a total of $82,000 split $60,000 stocks and $22,000 bonds. Inadvertently, bonds have become about 27% of your portfolio. In order to bring your portfolio back into the proper balance, you take $5,600 out of your bonds and put it into your stock positions to restore your target weightings. In this way, even when your portfolio takes an overall beating due to possibly being overexposed to equities in a bad stretch for them you still buy in at the lows even though it would otherwise appear that you can't commit any more to equities. This isn't exactly a shocking revelation, but it is one that some people don't think of.
Now, if you have a $5,000 portfolio or even a $10,000 portfolio as opposed to a $100,000 portfolio, the transaction costs involved here probably either come close to or entirely eliminate the gains from very frequent rebalancing. If you rebalance every month, you have two transactions at $10 a piece for $240 in a year, not to mention the capital gains you might accumulate in the process. This is one persistent problem for smaller portfolios versus larger ones which is that you are more wedded to individual investment decisions due to a lack of flexibility in getting out of them.
In any case, I realized that I neglected to post what the asset allocation model said for September. Suffice it to say that it still points toward the same 80/20 split in favor of equities that it has since we have been modeling it. However, after the increase in stock prices in September and a slight narrowing of corporate credit spreads, the overall score wasn't quite as strong. Remember that the model has minimum asset allocations of 20% bonds or equities no matter how favorable the indicators become for one asset class or another.
In any case, now might be a good time to discuss that even with fixed asset allocations like this there are some nuances that you have to take into account regarding re-balancing. If you rebalance every month where you assess your actual allocations compared to the targets, a result many don't think of is that, even with static asset allocations, you do end up accumulating more of the underperforming asset class at its bottom. I've actually gotten some confused looks from people on this point so I will explain it in a clear example.
For example, let's say that you have $100,000 (most of us wish) split 80/20 stocks and bonds respectively. In the course of three months, the stock portion of your portfolio loses 25% and the bond portion rises 10%. You will have a total of $82,000 split $60,000 stocks and $22,000 bonds. Inadvertently, bonds have become about 27% of your portfolio. In order to bring your portfolio back into the proper balance, you take $5,600 out of your bonds and put it into your stock positions to restore your target weightings. In this way, even when your portfolio takes an overall beating due to possibly being overexposed to equities in a bad stretch for them you still buy in at the lows even though it would otherwise appear that you can't commit any more to equities. This isn't exactly a shocking revelation, but it is one that some people don't think of.
Now, if you have a $5,000 portfolio or even a $10,000 portfolio as opposed to a $100,000 portfolio, the transaction costs involved here probably either come close to or entirely eliminate the gains from very frequent rebalancing. If you rebalance every month, you have two transactions at $10 a piece for $240 in a year, not to mention the capital gains you might accumulate in the process. This is one persistent problem for smaller portfolios versus larger ones which is that you are more wedded to individual investment decisions due to a lack of flexibility in getting out of them.
Friday, September 3, 2010
Another View on Interest Rates and PE Ratios
In the interest of fairness, here is a view saying that comparing interest rates and PE ratios is a useless exercise: http://www.marketwatch.com/story/are-stocks-really-undervalued-2010-09-03?dist=beforebell
I have several issues with the way the study was conducted as it seems a painfully simply regression analysis for a firm that specializes in it. What I found in my own research was that periods of a big positive spread between earnings yield and interest rates correlated very highly with periods before a major bull market and the inverse was also true. There was one period where this relationship broke down badly which was the 1990s, but that was the only one I could find.
I will do my own regression along the lines of the way they designed it and try to figure out how they came up with what they did because my knowledge of the data does not seem to support the notion here. Now, they used real rates of return against nominal comparisons of PE ratios and interest rates, whereas I kept everything in nominal terms.
I have several issues with the way the study was conducted as it seems a painfully simply regression analysis for a firm that specializes in it. What I found in my own research was that periods of a big positive spread between earnings yield and interest rates correlated very highly with periods before a major bull market and the inverse was also true. There was one period where this relationship broke down badly which was the 1990s, but that was the only one I could find.
I will do my own regression along the lines of the way they designed it and try to figure out how they came up with what they did because my knowledge of the data does not seem to support the notion here. Now, they used real rates of return against nominal comparisons of PE ratios and interest rates, whereas I kept everything in nominal terms.
Labels:
Asset Allocation,
Asset Allocation Model,
Interest Rates,
PEs
Sunday, August 15, 2010
Dynamic Asset Allocation Model: August Update
I had hoped to do these on a more regular schedule, but life has not been particularly permitting on that front. In any case, the August Dynamic Asset Allocation Model suggests an 80% weighting for equities going forward. Of course, this is the same as it has been since pretty much the end of 2008 with a few small twinges back and forth here and there.
However, August did see some interesting movement in a couple of the indicators. The yield curve measure moved down as ten year rates have continued to come in. Corporate spreads also narrowed in August, suggesting looser credit conditions for corporations, which is bearish for the model due to the contrarian intention of the indicator. The overall model remains very bullish because the earnings yield metric is at levels similar to the early 1950s as well as the bottom in 1974, which is immensely bullish for stocks.
Still, this model was based on historical patterns and a deflationary environment would ruin some well established historical relationships on which investors have relied. Principally, in our discussions of PE ratios we talked about how PE ratios work because there is the implicit assumption that earnings in the future will be higher. In a deflationary environment this isn't the case. As such, keep your eyes peeled. I still think that stocks are quite cheap on a historical basis relative to alternative investments, but it isn't as unqualified as the indicators in the model would suggest.
Labels:
Asset Allocation,
Asset Allocation Model,
Interest Rates,
PEs
Saturday, July 17, 2010
Quick Update of Dynamic Asset Allocation Model
The model still suggests an 80% allocation to equities in the current environment. Despite the contraction in the yield curve, the expansion of the earnings yield measure and corporate credit spreads added more than the narrowing in the yield curve took away.
On a fundamental basis, this allocation makes sense for entirely another reason. The dividend yield on the S&P 500, forgetting earnings for a moment, is just shy of 2%, so you are only giving up 1% on 10-year treasuries just there. Among those stocks that are actually paying dividends right now, the average yield is 2.54%. Further, these numbers are depressed by the fact that almost all financial stocks, normally payers of robust dividends, have pulled back over the past two years to pay virtually nothing. Case in point, JP Morgan Chase (JPM) was once a payer of a 4% dividend or better, but in order to preserve capital during the financial crisis it put that down to 0.5%.
With such a narrow differential between bonds and stocks in terms of income generation, it doesn't make long term sense to be heavily in bonds at the moment. From a trading perspective, it varies, but for those without sufficient cash to trade, it makes the most sense to be heavily in equities in the present situation.
On a fundamental basis, this allocation makes sense for entirely another reason. The dividend yield on the S&P 500, forgetting earnings for a moment, is just shy of 2%, so you are only giving up 1% on 10-year treasuries just there. Among those stocks that are actually paying dividends right now, the average yield is 2.54%. Further, these numbers are depressed by the fact that almost all financial stocks, normally payers of robust dividends, have pulled back over the past two years to pay virtually nothing. Case in point, JP Morgan Chase (JPM) was once a payer of a 4% dividend or better, but in order to preserve capital during the financial crisis it put that down to 0.5%.
With such a narrow differential between bonds and stocks in terms of income generation, it doesn't make long term sense to be heavily in bonds at the moment. From a trading perspective, it varies, but for those without sufficient cash to trade, it makes the most sense to be heavily in equities in the present situation.
Labels:
Asset Allocation,
Asset Allocation Model,
Banks,
Dividends,
JPM
Thursday, June 3, 2010
Dynamic Asset Allocation Model: May Update
I will continue to provide monthly updates for the dynamic asset allocation model I outlined in an earlier post because the only real way to see what a model is made of is to test it in real time. Let's see what happened in May.
Using monthly closing numbers for the S&P 500, Ten Year Treasury, 90-day T-Bill, and Aaa 10-year Corporate Bond, the model suggests a continued heavy weighting toward equities at the maximum of 80%. Now, of course it suggested 80% before the bottom fell out of the market last month too, but the interest rate measures are largely designed to suggest the relative economic value of stocks and bonds and not to forecast crises.
Due to the fall in the S&P 500 and 10-year interest rates, the earnings yield measure improved noticeably. Corporate credit spreads widened, also putting upward pressure on the equity allocation. The one negative is that the yield curve noticeably flattened, virtually entirely a function of the fall in ten year interest rates. However, the overall composite score for the model on which the asset allocation is based reached one of its highest levels in the 1954-2010 period. In other words, if I let the model fluctuate up to 100% allocations in either stocks or bonds, it would be pretty damn close to 100%.
Frankly, this makes sense given where interest rates are right now. Bonds simply are not attractive relative to stocks at these interest rates given the recovery in corporate earnings. In the short run, as a crisis play, they have made sense, but remaining in treasuries for too long will wipe out those gains because 3.3% long term rates are not going to stay.
Take it or leave it. This is not professional investment advice, but this approach continues to suggest a high weighting toward stocks.
Thursday, May 27, 2010
Threading Strategies Together
Several different strategies have been discussed here on Finance Monitor along with numerous individual investments and I thought I would provide some context on how to view the discussions in the context of your own investments. The fundamental goal of this post is to weave several different posts on different subjects together. I will try to provide links so that you can quickly look up the prior discussions.
I guess the proper way to start this conversation was with the prior post on risk reduction in portfolio construction. This is one way of looking at your macro strategy, though there are many potential variations on this broader strategy. Within the core portfolio, either use equity index funds or balanced funds and basically just try to keep your overall allocation right, unless you want to be a little more active here. Then, you can engage in what was discussed on the post on dynamic asset allocation.
To do this, use the SPY and TLT ETFs at a basic level. If you have less than $2,000, I strongly encourage you to only re-balance when interest rates suggest you make a large reallocation from stocks to bonds or bonds to stocks. If you re-balance with every twinge, you'll get eaten alive by commissions. For example, let's say the model changes each month and you re-balance with $7 commissions each time (on both purchase and sale) with a $2,000 balance. You will incur $14 a transaction 12 times for a total of $168 in commissions. That would be 8.4% of your portfolio or greater than your average annual gain. With $20,000, it's 0.84%, which is bad, but not ruinous. If you are so fortunate to get up to $100,000, the fees are very low indeed. The ETF fees for TLT and SPY are also very low. In the case of SPY they are 0.09% per year and 0.15% on TLT.
I guess the proper way to start this conversation was with the prior post on risk reduction in portfolio construction. This is one way of looking at your macro strategy, though there are many potential variations on this broader strategy. Within the core portfolio, either use equity index funds or balanced funds and basically just try to keep your overall allocation right, unless you want to be a little more active here. Then, you can engage in what was discussed on the post on dynamic asset allocation.
To do this, use the SPY and TLT ETFs at a basic level. If you have less than $2,000, I strongly encourage you to only re-balance when interest rates suggest you make a large reallocation from stocks to bonds or bonds to stocks. If you re-balance with every twinge, you'll get eaten alive by commissions. For example, let's say the model changes each month and you re-balance with $7 commissions each time (on both purchase and sale) with a $2,000 balance. You will incur $14 a transaction 12 times for a total of $168 in commissions. That would be 8.4% of your portfolio or greater than your average annual gain. With $20,000, it's 0.84%, which is bad, but not ruinous. If you are so fortunate to get up to $100,000, the fees are very low indeed. The ETF fees for TLT and SPY are also very low. In the case of SPY they are 0.09% per year and 0.15% on TLT.
Labels:
Asset Allocation,
Asset Allocation Model,
BP,
China,
Church and Dwight,
EEM,
EWP,
EWY,
SPY,
Stock Picking,
Strategy,
TLT
Sunday, May 23, 2010
"In Defense of the Humble Balanced Portfolio" - Morningstar
I stumbled across this good article from Morningstar "In Defense of the Humble Balanced Portfolio". This relates to a previous discussion on overall investment strategies and several subsequent posts on asset allocations and portfolio construction.
Incidentally, they do note some shortcomings of a simple static 50/50 stock and bond mix, or any static ratio for that matter, which is what prompted me to work on the dynamic asset allocation model over the past year or so. Even the automatic rebalancing target date funds have their problems as they rebalance at linear rates that may not be opportune given market cycles. That's why I prefer the dynamic, interest rate signal approach.
What do you all think?
Incidentally, they do note some shortcomings of a simple static 50/50 stock and bond mix, or any static ratio for that matter, which is what prompted me to work on the dynamic asset allocation model over the past year or so. Even the automatic rebalancing target date funds have their problems as they rebalance at linear rates that may not be opportune given market cycles. That's why I prefer the dynamic, interest rate signal approach.
What do you all think?
Thursday, May 13, 2010
Asset Allocation: A Dynamic Model
There are many approaches to asset allocation and I will try to give them all justice in turn. However, as promised, I will unveil one approach that I worked on for several months designed to pull off a difficult task: Picking the precise moments to shift in and out of stocks.
The model relies on three basic indicators:
1. The spread between earnings yield on the S&P 500 Index and the yield on 10-year Treasury Bonds
2. The spread between 10-year Treasury Bond rates and 90-day T-bills (one measure of the slope of the yield curve)
3. The spread between AAA rated corporate bonds and 10-year Treasury Bonds
For the uninitiated, earnings yield is calculated in the following way for an individual stock:
(1/PE ratio)*100% = earnings yield
For example on a 25 PE: (1/25)*100% = 4% earnings yield
The basic logic for each indicator being included is as follows:
1. The earnings yield spread is a measure of the relative valuation between stocks and bonds. A wide spread indicates that stocks are undervalued while an inverted spread indicates that stocks are overvalued.
2. The yield curve measurement relies on the predictive power of the Treasury yield curve for predicting major economic cycles. A heavily upwardly sloped yield curve indicates that the market expects short rates to rise in the near term because economic growth, and therefore inflation expectations, will be rising. An inverted yield curve indicates the opposite.
3. The corporate credit spread measurement is a proxy for financial panic and complacency. A wide spread indicates that markets are skittish and investors will only buy corporate bonds at severe discounts to Treasuries. A narrow spread indicates the opposite. This is a contrarian indicator. It is specified to give favorable signals when things look frightening for corporate credit.
Without getting into too many specifics at this point, the model relies on a composite score of the three indicators to give signals of when to re-balance your portfolio. The more favorable the composite becomes, the more you should shift into stocks. The more it indicates unfavorable conditions the more you should shift into bonds. Fairly simple, though the calculations were a pain.
The model has upper and lower bounds for asset allocation of 80% and 20% meaning that neither stocks or bonds can ever be less than 20% of your portfolio. I may respecify this to allow for 100% allocations, but I am not sold on that idea yet.
Here's a chart of how one specification of this model allocates:
It may look very volatile, but bear in mind this is over 57 years and it is crunched into a single graph.
Now, the fundamental question is: How does this work in practice? Does it provide a high rate of return with high rates of stability?
Well, historically back tested it produces a compounded annual growth rate of 8.0% vs 7.0% for an all-stock portfolio over the same period. More importantly, it does this with a lower range of volatility. The annual standard deviation for returns is 8.6% for the model and 15.3% for an all stock portfolio. Graphically, it looks something like this (red line is all stocks, blue line is the model under the specification above):
The graph is in logarithmic terms because it provides a more accurate picture. As you can see, the model is still prone to some losses in severe market downturns, but on the whole it is more stable.
One challenge of the model is that it is subject to long periods of under-performance like any balanced portfolio. The trick to the model is that it makes up a lot of ground in bear markets because it correctly moves investors into a bond-heavy position just before major declines. It does move back into stocks too soon in 2008, but it does have investors fully invested at the bottom and in for the subsequent rally. In the bear markets of 2000-2002, 1990, 1981-82, and 1973-74 it performs very well indeed.
Of course, the future might not look anything like the past, but I think such an approach is promising.
What do you all think?
Btw, the model currently suggests an 80-20 stock/bond split.
The model relies on three basic indicators:
1. The spread between earnings yield on the S&P 500 Index and the yield on 10-year Treasury Bonds
2. The spread between 10-year Treasury Bond rates and 90-day T-bills (one measure of the slope of the yield curve)
3. The spread between AAA rated corporate bonds and 10-year Treasury Bonds
For the uninitiated, earnings yield is calculated in the following way for an individual stock:
(1/PE ratio)*100% = earnings yield
For example on a 25 PE: (1/25)*100% = 4% earnings yield
The basic logic for each indicator being included is as follows:
1. The earnings yield spread is a measure of the relative valuation between stocks and bonds. A wide spread indicates that stocks are undervalued while an inverted spread indicates that stocks are overvalued.
2. The yield curve measurement relies on the predictive power of the Treasury yield curve for predicting major economic cycles. A heavily upwardly sloped yield curve indicates that the market expects short rates to rise in the near term because economic growth, and therefore inflation expectations, will be rising. An inverted yield curve indicates the opposite.
3. The corporate credit spread measurement is a proxy for financial panic and complacency. A wide spread indicates that markets are skittish and investors will only buy corporate bonds at severe discounts to Treasuries. A narrow spread indicates the opposite. This is a contrarian indicator. It is specified to give favorable signals when things look frightening for corporate credit.
Without getting into too many specifics at this point, the model relies on a composite score of the three indicators to give signals of when to re-balance your portfolio. The more favorable the composite becomes, the more you should shift into stocks. The more it indicates unfavorable conditions the more you should shift into bonds. Fairly simple, though the calculations were a pain.
The model has upper and lower bounds for asset allocation of 80% and 20% meaning that neither stocks or bonds can ever be less than 20% of your portfolio. I may respecify this to allow for 100% allocations, but I am not sold on that idea yet.
Here's a chart of how one specification of this model allocates:
It may look very volatile, but bear in mind this is over 57 years and it is crunched into a single graph.
Now, the fundamental question is: How does this work in practice? Does it provide a high rate of return with high rates of stability?
Well, historically back tested it produces a compounded annual growth rate of 8.0% vs 7.0% for an all-stock portfolio over the same period. More importantly, it does this with a lower range of volatility. The annual standard deviation for returns is 8.6% for the model and 15.3% for an all stock portfolio. Graphically, it looks something like this (red line is all stocks, blue line is the model under the specification above):
The graph is in logarithmic terms because it provides a more accurate picture. As you can see, the model is still prone to some losses in severe market downturns, but on the whole it is more stable.
One challenge of the model is that it is subject to long periods of under-performance like any balanced portfolio. The trick to the model is that it makes up a lot of ground in bear markets because it correctly moves investors into a bond-heavy position just before major declines. It does move back into stocks too soon in 2008, but it does have investors fully invested at the bottom and in for the subsequent rally. In the bear markets of 2000-2002, 1990, 1981-82, and 1973-74 it performs very well indeed.
Of course, the future might not look anything like the past, but I think such an approach is promising.
What do you all think?
Btw, the model currently suggests an 80-20 stock/bond split.
Subscribe to:
Posts (Atom)