Disclaimer

Opinions and observations expressed on this blog reflect the authors' individual experiences and should not be construed to be financial advice. None of the members of this blog are licensed financial advisors. Please consult your own licensed financial advisor if you wish to act on any recommendations here.
Showing posts with label Credit Spreads. Show all posts

Sunday, October 30, 2011

The European Debt Crisis: Was the Rescue Package Enough?

The stock market's initial reaction appears to offer the answer of "yes", but then again we saw fairly convincing rallies early on in the financial crisis in 2007 (as I always like to remind people, our problems began in the summer of 2007, not 2008).  Equity markets often give false signals, perhaps more frequently than other markets.

As of right now, it does not appear that European debt markets are buying into the program here.  For instance, we have not seen Italian bond yields gap down:

The same troubling thing holds true in Portugal:


There rates are down a touch, but still nothing noticeable, considering that they are trading close to 1,000 basis points above German 10-year bonds.

The issue, as I see it, is a similar one to what we went through in 2009.  Let's back up for a moment here and state clearly why sovereign debt defaults are important to us: they threaten the health of major banks.  That's the whole reason that even more stable countries live in mortal fear of a Greece or a Portugal going under.  Banks like buying sovereign debt for their reserves due to its low default rate.  If the debt they buy becomes distressed so they have to mark it down or if the borrowers default, that undermines the banks' capitalization and they need to, at best, issue more shares to recapitalize, which dilutes the value of existing shareholders.  In a worst case scenario, the whole rotten thing comes crashing down and the banks fail catastrophically.  I think that we all know the consequences that stem from that scenario.

As such, just like the situation we faced in early 2009, this is about whether the banks can reasonably attain enough capital to recapitalize to offset massive losses coming down the pike.  In our case, it was the continuing doubts over the mountains of bad mortgages that banks were carrying on their books above the likely value that they could realize those assets at.  Investors speculated for weeks and months about just what kind of hits our banks would have to take and it caused our markets to go into a total tailspin that took the Dow down to 6,500 at one point.  Just an aside, there is no rational model by which one can call that a fair price for the market at that point.  What came along to really solve the issue were the stress tests of our banks that detailed the amounts our banks needed to raise in additional capital in order to survive two differing economic scenarios.  While there was criticism over the rigor of the tests at the time, it really did prove to be a turning point, along with expansionary monetary and fiscal policy that had begun just before that.  They put a number on how much the banks would have to raise and investors could use that figure to pivot their decision making on whether or not to buy shares.  Before that point, it had been somewhat of an unknown.

The markets had already begun a recovery before the release of the test results in May 2009 (the bottom was March 9th), including a massive rally in bank shares, but as the year went on, the financial stocks eventually added another huge leg to their rally in the summer as the recapitalizations went along without much incident.  From then on in, the markets regained confidence, and things began to return to some level of normalcy.  There were many other measures taken, so I don't want to exaggerate the importance of the stress tests, but the point is that once the health of the banks was assured, the markets and the economy at large could move on.

The key to Europe is whether the banks will now be sufficiently recapitalized.  The stress tests there have been of questionable credibility, often only focusing on macroeconomic conditions and not pricing in what would happen with large write-downs of sovereign debt.  That has started to change in the most recent iterations, but some analysts think that the stress tests are low-balling the needed capital by as much as $200 billion.  As long as investors are not convinced that the banks' balance sheets are now as secure as the Maginot Line... wait a moment... as unsinkable as the Titanic... as solid as the walls of Constantinople... erm, well, pretty safe, we will be prone to a renewed crisis.

Of course, history may well show that this was the turning point and many of the naysayers have been wrong. After all, credit spreads here did not really start coming in until a full month after the stock market bottomed in March of 2009.  (CLICK ON IMAGE FOR LARGER PICTURE)


Spreads did not begin their true downward trajectory until early to mid April and did not actually reach quasi-normal levels until October.  In other words, it could be a while before we really know.  At this moment, I am doubtful that we have seen the last of this crisis.

Thursday, May 13, 2010

Asset Allocation: A Dynamic Model

There are many approaches to asset allocation and I will try to give them all justice in turn. However, as promised, I will unveil one approach that I worked on for several months designed to pull off a difficult task: Picking the precise moments to shift in and out of stocks.

The model relies on three basic indicators:

1. The spread between earnings yield on the S&P 500 Index and the yield on 10-year Treasury Bonds
2. The spread between 10-year Treasury Bond rates and 90-day T-bills (one measure of the slope of the yield curve)
3. The spread between AAA rated corporate bonds and 10-year Treasury Bonds

For the uninitiated, earnings yield is calculated in the following way for an individual stock:
(1/PE ratio)*100% = earnings yield

For example on a 25 PE: (1/25)*100% = 4% earnings yield

The basic logic for each indicator being included is as follows:

1. The earnings yield spread is a measure of the relative valuation between stocks and bonds. A wide spread indicates that stocks are undervalued while an inverted spread indicates that stocks are overvalued.

2. The yield curve measurement relies on the predictive power of the Treasury yield curve for predicting major economic cycles. A heavily upwardly sloped yield curve indicates that the market expects short rates to rise in the near term because economic growth, and therefore inflation expectations, will be rising. An inverted yield curve indicates the opposite.

3. The corporate credit spread measurement is a proxy for financial panic and complacency. A wide spread indicates that markets are skittish and investors will only buy corporate bonds at severe discounts to Treasuries. A narrow spread indicates the opposite. This is a contrarian indicator. It is specified to give favorable signals when things look frightening for corporate credit.

Without getting into too many specifics at this point, the model relies on a composite score of the three indicators to give signals of when to re-balance your portfolio. The more favorable the composite becomes, the more you should shift into stocks. The more it indicates unfavorable conditions the more you should shift into bonds. Fairly simple, though the calculations were a pain.

The model has upper and lower bounds for asset allocation of 80% and 20% meaning that neither stocks or bonds can ever be less than 20% of your portfolio. I may respecify this to allow for 100% allocations, but I am not sold on that idea yet.

Here's a chart of how one specification of this model allocates:

It may look very volatile, but bear in mind this is over 57 years and it is crunched into a single graph.

Now, the fundamental question is: How does this work in practice? Does it provide a high rate of return with high rates of stability?

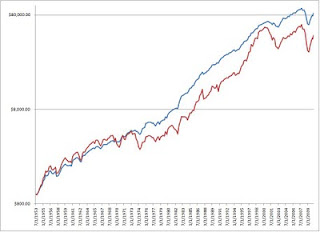
Well, historically back tested it produces a compounded annual growth rate of 8.0% vs 7.0% for an all-stock portfolio over the same period. More importantly, it does this with a lower range of volatility. The annual standard deviation for returns is 8.6% for the model and 15.3% for an all stock portfolio. Graphically, it looks something like this (red line is all stocks, blue line is the model under the specification above):


The graph is in logarithmic terms because it provides a more accurate picture. As you can see, the model is still prone to some losses in severe market downturns, but on the whole it is more stable.

One challenge of the model is that it is subject to long periods of under-performance like any balanced portfolio. The trick to the model is that it makes up a lot of ground in bear markets because it correctly moves investors into a bond-heavy position just before major declines. It does move back into stocks too soon in 2008, but it does have investors fully invested at the bottom and in for the subsequent rally. In the bear markets of 2000-2002, 1990, 1981-82, and 1973-74 it performs very well indeed.

Of course, the future might not look anything like the past, but I think such an approach is promising.

What do you all think?

Btw, the model currently suggests an 80-20 stock/bond split.