Disclaimer

Opinions and observations expressed on this blog reflect the authors' individual experiences and should not be construed to be financial advice. None of the members of this blog are licensed financial advisors. Please consult your own licensed financial advisor if you wish to act on any recommendations here.

Friday, May 16, 2014

JCPenney Coming Back?

First, full disclosure here, I hold a modest position in January 2015 JCPenney (JCP) $10 call options as a small proposition bet that JCPenney would indeed at least recover enough for me to make some money. I'm a little more ambiguous on the idea that the company will totally recover from what it's been through.

With that out of the way, JCP rallied quite a bit today, jumping 16.25% to $9.73, its highest close since about November, on a favorable earnings report last night. Sales growth topped estimates and the losses were narrower. See this press release for the overview: http://www.marketwatch.com/story/jcpenney-reports-fiscal-2014-first-quarter-results-2014-05-15

Part of the reason same store sales growth was pretty solid at 6.2% was due to a pretty favorable comparison since in the first quarter of last year they were really in their down stroke phase and sales dropped by solid double digits. Add to that the fact that closing your weakest performing stores prunes the numbers to give some extra lift and you get a pretty decent number. I'll be awfully curious to see if this can be maintained going forward.

Importantly, gross margins have started firming up and the company apparently expects them to continue to grow. It also appears that they are beginning to move toward eliminating their longstanding hemorrhage of cash. This is important since one of the very legitimate concerns with JCP is that the company was swiftly moving toward Chapter 11. Those concerns are gone for now. Based on present information, it's not easy to see how that risk is still relevant.

I think that their result today shores up my conviction in my January 2015 $10 calls, but I'm not exactly hot and bothered to add to the position. There are still a great many difficulties there, including the possibility of share price dilution should the company need to recapitalize. It doesn't have the prettiest balance sheet in the world with a shareholder's equity position that has fallen from $5.46 billion in 2011 to just over $3 billion now. This is also just a much smaller company than it once was, with revenues dropping from $17.76 billion in 2011 to $11.86 billion in 2014. While they seem to have stabilized at the present level, it's quite unlikely that they'll be making any runs at their old all-time highs anytime soon. Just to give a sense of what has happened to it, have a look at this:
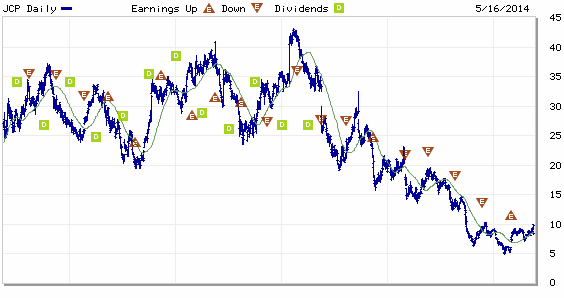
Chart courtesy of Marketwatch.com

Here are some stories by those that have spent more time than me on JCP, first those expressing caution:


On the more bullish side, we have these stories:


Of course, this is what makes a market. I'm a little cautious myself since the department store industry in general isn't a particularly great one at the moment, even if JCPenney is embracing an online presence very aggressively. Its glory days are, I think, in the past and we're just basically speculating that it got undervalued due to death-spiral concerns about its liquidity. If it can hang on and restore modest profitability, JCP makes sense for my position and for maybe some quick trades, but I'm skeptical regarding its long-term prospects.

Of course, I've been burned on clothing retailers before, so I'm prepared to be surprised again.

Wednesday, May 7, 2014

How long do you have to hold stocks to smoothe out all of the swings?

This is a question, or some variant thereof, I get quite a lot. We very often hear that you'll earn anywhere between 7-10% on stocks per year over the long term. This is true, but just how long are we talking here? If we do the stretch of 1928-2013, the historical compounded annual growth rate (CAGR) was around 9.2%.

The problem is that after an 85-year holding period you'll look something like this:


5 years isn't anywhere near enough and neither is 10 years. The answer is that you'll have to hold for 20 years or more to really guarantee that you'll get something in that range. Even the 20 year holding periods can swing a little bit above or below those long-term targets, but once you get out to 30 year or 40 year periods we're finally there. You get nice stable rates of return that don't vary much at all. Over those periods, stocks are basically as risky as going to the bathroom. See the chart below. The way to read this is that each line represents the annualized return of that holding period through that year. So, for 1968, the 40-year line represents the annualized return for the 40 years through 1968.


So, if you're thinking 10 years gets the job done and averages everything out, think again. You have to invest with a long time horizon if you want to truly wash out the wild swings.

Putting Riskier Assets Into Your Portfolio Stabilizes It?

Alright, that was a much longer hiatus than I would care to ever repeat and I decided to get back into the swing of things here by writing about one of my favorite little facts in portfolio theory. That is the peculiar fact that adding stocks to an all-bond portfolio actually stabilizes your returns and you get a higher return for less risk.

You know how economists always say there's no free lunch? Well, there's an exception to that rule and it comes from what is referred to as the "efficient frontier," which amounts to a rule about assessing the true relationship between risk and reward. Long story short, there isn't a straight linear relationship. There's a weird bend in the curve that makes a 27% stock portfolio as safe as a 0% stock, 100% bond portfolio and makes a 15% stock portfolio the least risky of all. For all of the charts below, I used data on total returns for stocks and 10-year U.S. from 1928 to 2013.


But wait, there's more! Because of the fact that adding stocks to a portfolio increases your long-term annual returns, this actually means that you can reduce your volatility and increase your returns in that backward-bending portion of the volatility curve. 


The idea that risk and reward are strictly linearly related has been a longstanding fallacy that most people buy into, but there are even every day exceptions to that. For example, you can walk into a street with cars going 25 mph and the odds are that they will stop and not run you over, even though they'll be incredibly angry with you for making them hit the brakes. However, they might not hit the brakes and then you'll be run over. The risk there is pretty high and the reward is saving a few seconds on your commute. 

The reason that it's not linear in the case of investments has to do with the fact that the factors which move stocks and bonds are different. Bonds typically do well in environments where investors are risk-averse and the outlook for inflation is declining, often because growth is declining. Stocks generally (surprise!) do well when growth prospects are strong. There are years where their interests coincide, very notably 1995 and 1982, because falling interest rates are good for bonds and stocks, all else being held constant. The consequence is a distribution of returns that looks something like this.


There's a smattering of about 8 years where they both do very well and you can see that in the upper-right corner, but otherwise there's a decently strong inverse relationship between the two.

So, the conclusion here is that by introducing a riskier asset class, in this case stocks, into a portfolio that starts as 100% bonds, you actually reduce your long-term volatility and increase your returns at the same time.

Now, a related question is what allocation avoids the worst performance historically. The answer isn't quite the same, but it's close. 


It works out that an 11% asset allocation to stocks has had the smallest 1-year decline of any asset allocation at just over a 7% drop. This of course prompted the question of what is the best year each asset allocation has seen. There's no question that 100% stocks will see the best year, but the rest of the curve is kind of interesting.


I know it's a little spooky, almost like Quantum Entanglement, but facts are facts and it's important to know what asset allocations are truly best for reducing volatility if that's your preference.

In case you're curious about the history of this idea, Harry Markowitz, one of the all-time greats in financial economics, was the one who really popularized it. 

With that, it's good to be back and I hope to be posting more in the future.